Chapter 8 Excel and Large language models
Many AI tools are already embedded into Excel. We have already used some of these features in previous chapters:
- When you create a new variable in a new column using a formula, Excel will use it as an example to write the formula in all subsequent rows in the same column and automatically update as the data changes (“Formula by Example”).
- When creating a chart, Excel proposes a selection of charts likely to be relevant in “Recommended charts”.
With the incorporation of Large Language Models (LLMs) such as Microsoft Copilot within Excel, the capabilities of generative AI tools in Excel is likely to increase. In this section, we explore what these new capabilities may look like. It is strongly recommended that you perform all calculations using Excel or other programming software rather than ask an LLM to generate output for you.
All output in this section have been generated using ChatGPT5.2.
8.1 Find an Excel formula
If you do not know how to write a formula in Excel, you may ask a LLM to suggest a formula.
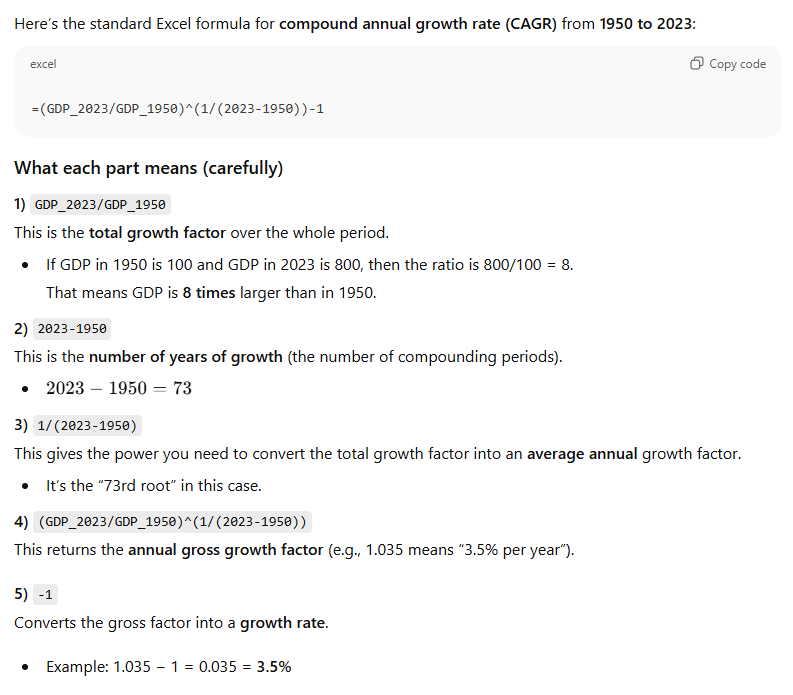
Example: formula for the compound annual growth rate:
Prompt (ChatGPT 5.2): I have annual GDP data spanning the period 1950 to 2023. Write an Excel formula I can use to calculate the compounded annual growth rate of GDP between 1950 and 2023. Explain carefully the formula.
ChatGPT 5.2 offers the following reply:
Check:
- Is the formula correct?
- Can you use the formula in Excel to calculate the compound annual growth rate of UK GDP per capita?
- Be careful that large language models may be “hallucinating” an Excel function.
8.2 Perform operations on data
Large language models can also be used to perform most of the tasks discussed in the previous sections.
Example: Extract UK data and create GDP per capita:
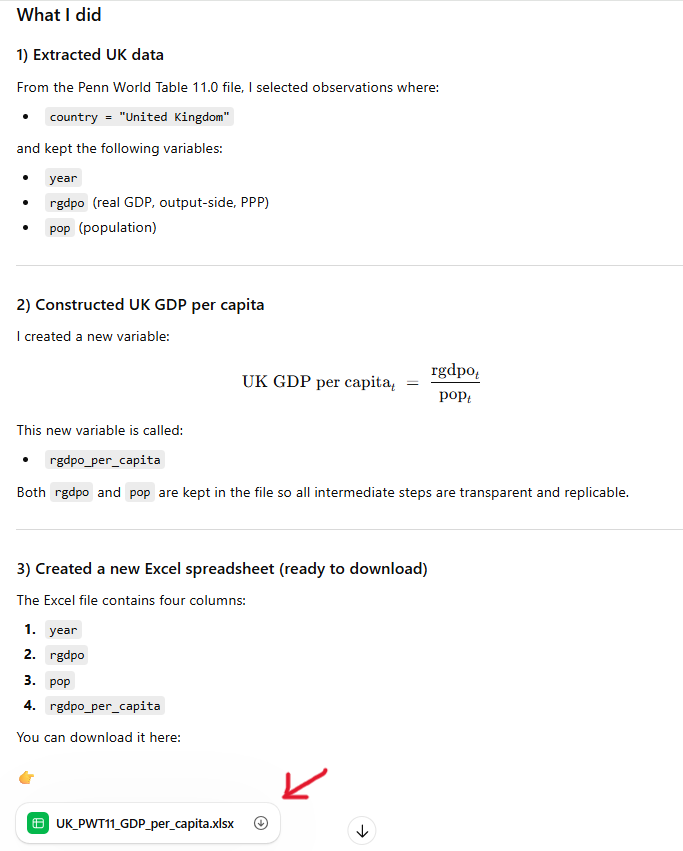
Prompt (ChatGPT 5.2): (attaching pwt110.xlsx) Using the PWT11.0 dataset attached, do the following tasks. 1) Extract “year”, “rgdpo” and “pop” for entries where “country” is equal to “United Kingdom”. 2) Construct the new variable for UK GDP per capita using the variables extracted. 3) Create a new Excel spreadsheet including the new variable, and including all intermediate steps ready to be downloaded.
ChatGPT 5.2 generates:
Python code used to extract the relevant data and create the new variable.
Output: new Excel spreadsheet
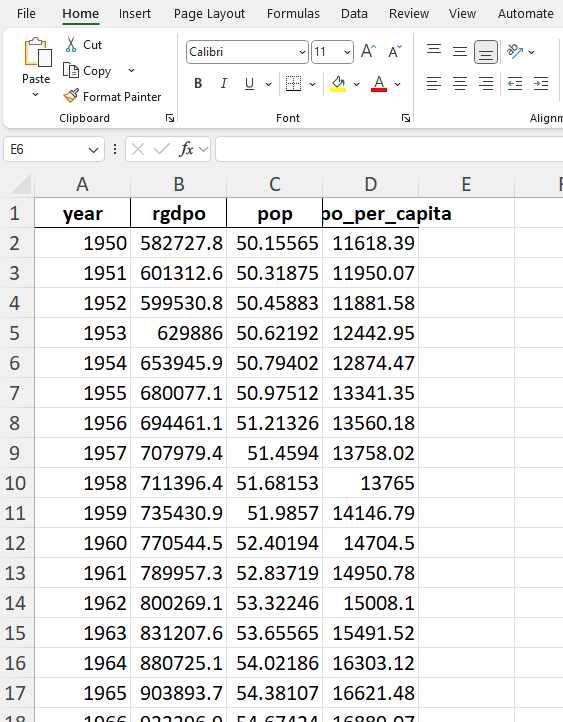
Opening the new spreadsheet:
Check:
- Compare this spreadsheet with that created in Section 1.1.
- Check that the first entry for UK GDP per capita is correct.
ChatGPT 5.2 provides this additional information:
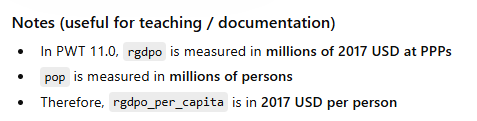
Check that this information is correct (Hint: it is not!).
Note that the more complex the task required, the less efficient it will be to delegate data analysis tasks to large language models.
8.3 Create complex graphs
Large language models can help create graphs using more complex functions.
Example: :
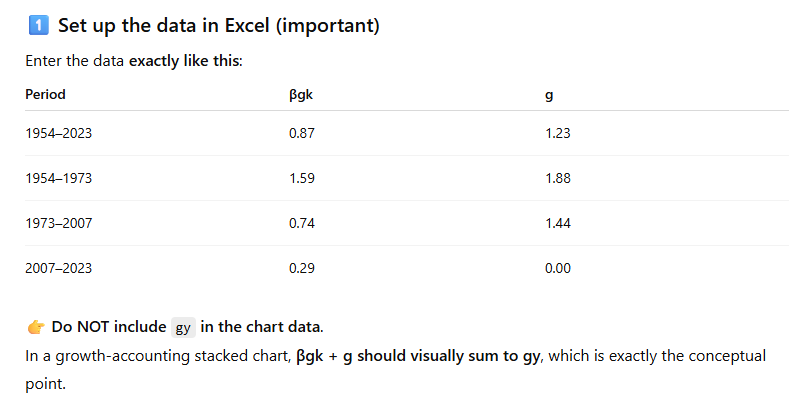
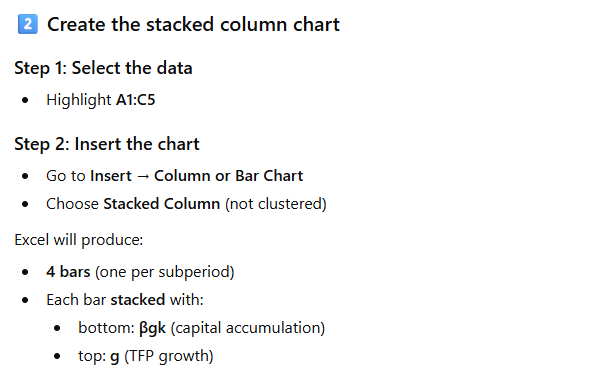
Prompt (ChatGPT 5.2): I would like to create a column chart representing the results of this growth accounting decomposition of UK labour productivity between 1954 and 2023. I want the graph to stack the contribution of capital accumulation (βgk) and TFP growth (g) in 4 different bars corresponding to the 4 subperiods. See data attached.

ChatGPT 5.2 generates:
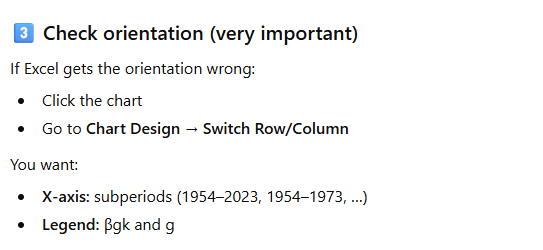
Check that the instructions allow you to construct the desired chart.
Note how important it is to describe precisely what you are trying to achieve and therefore to understand the data and the methodology!